Month: January 2017

Dot pattern

THE LETRATONE ERA.

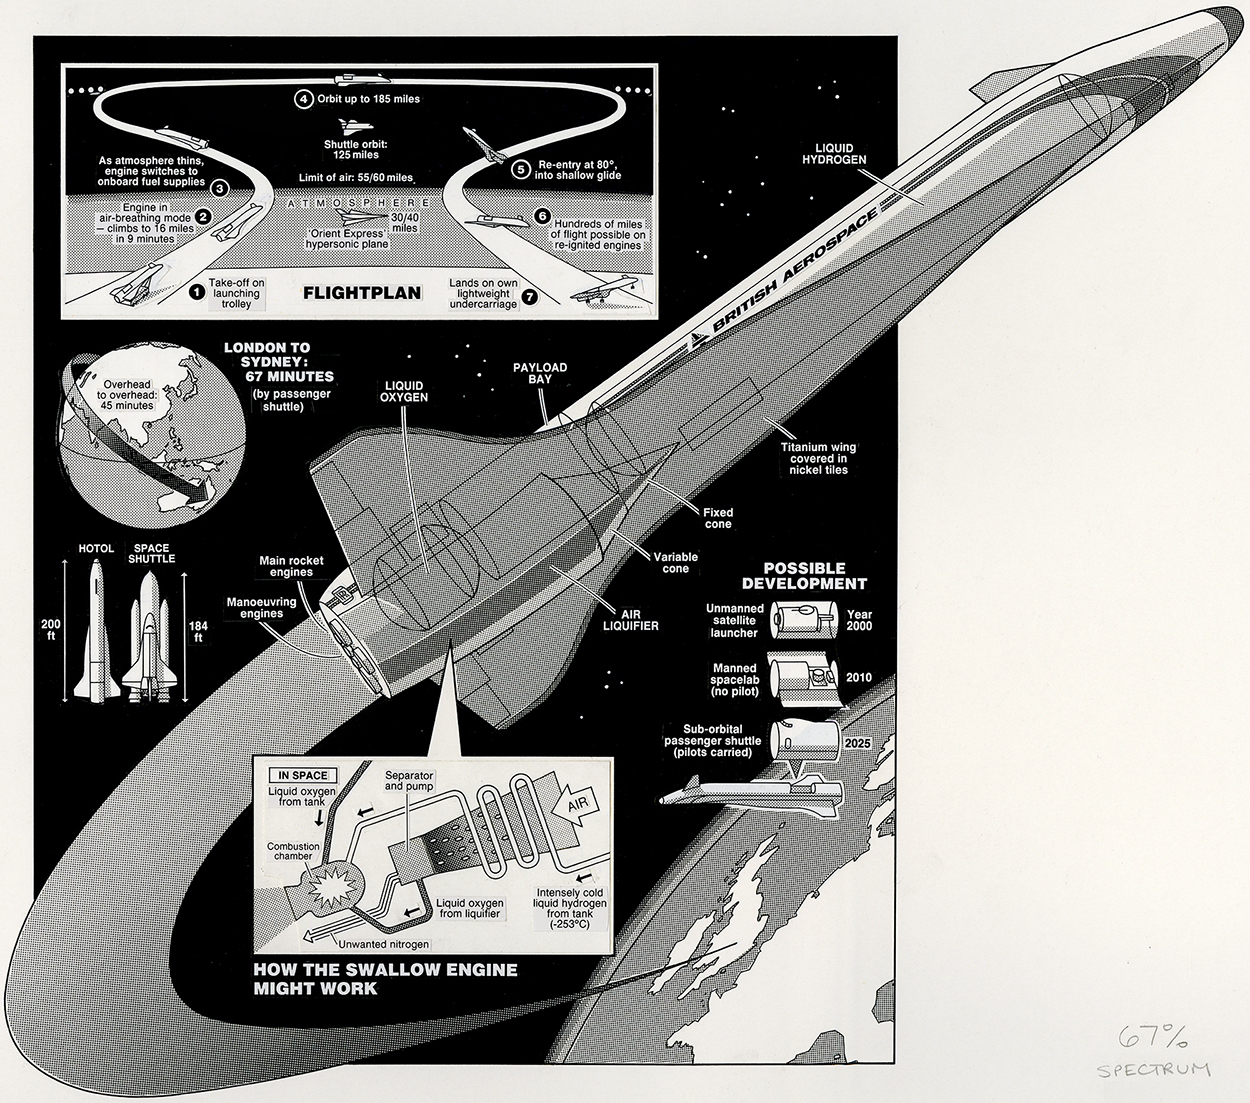
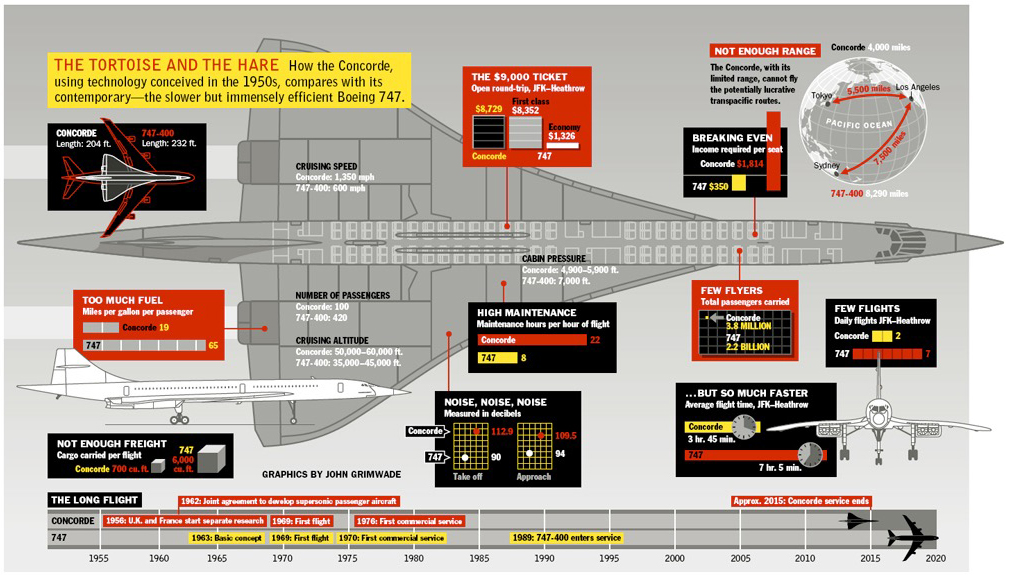
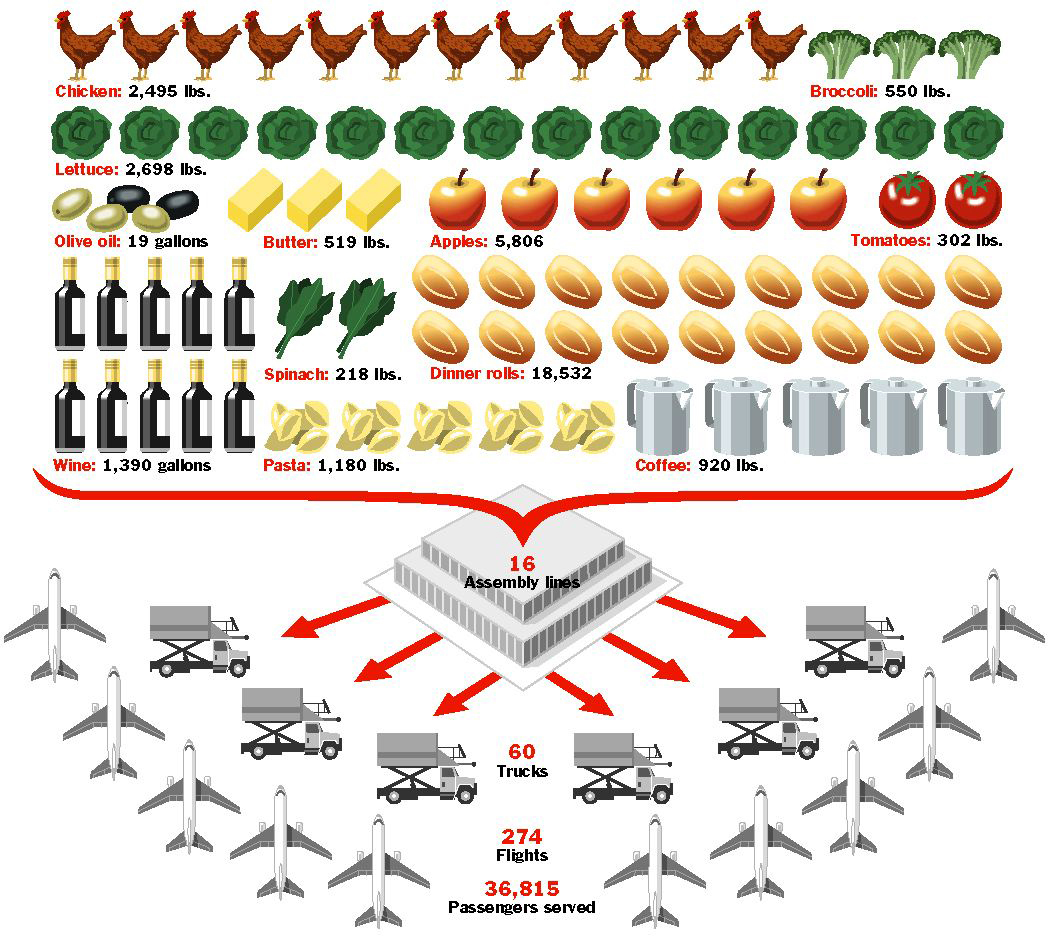
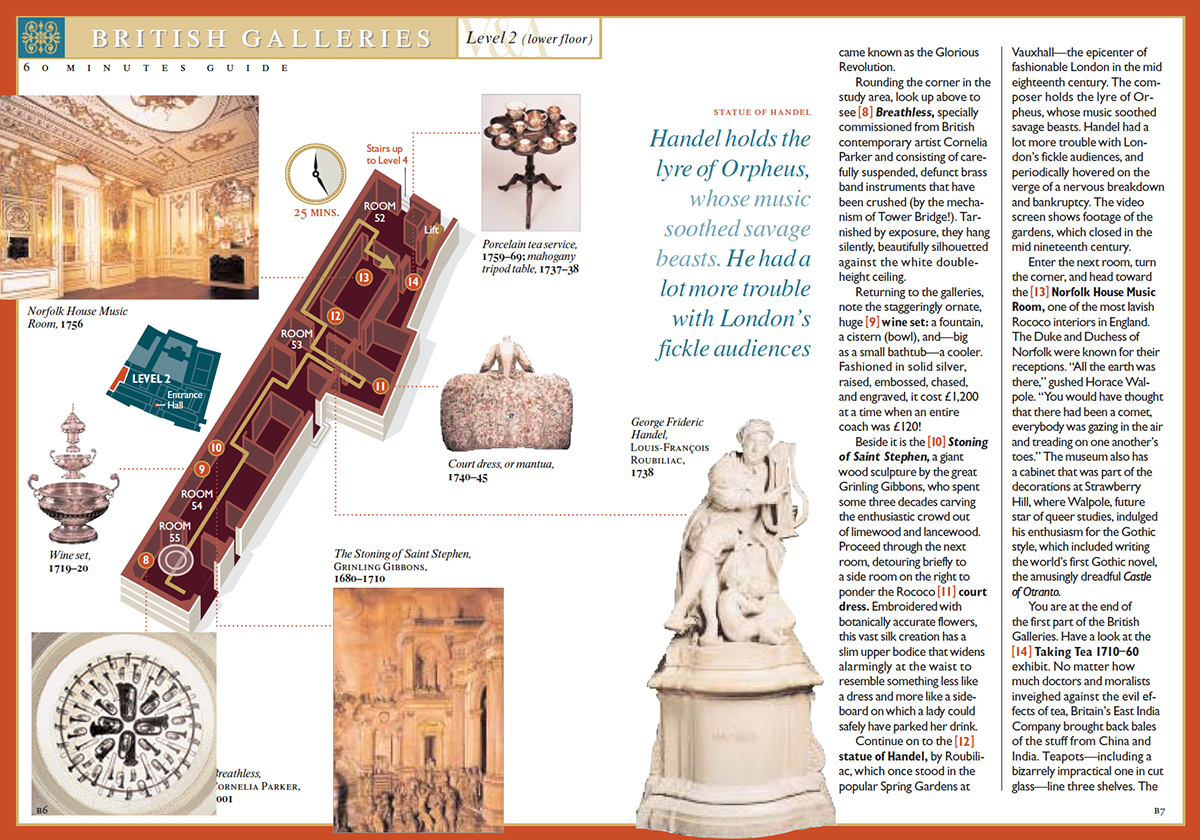
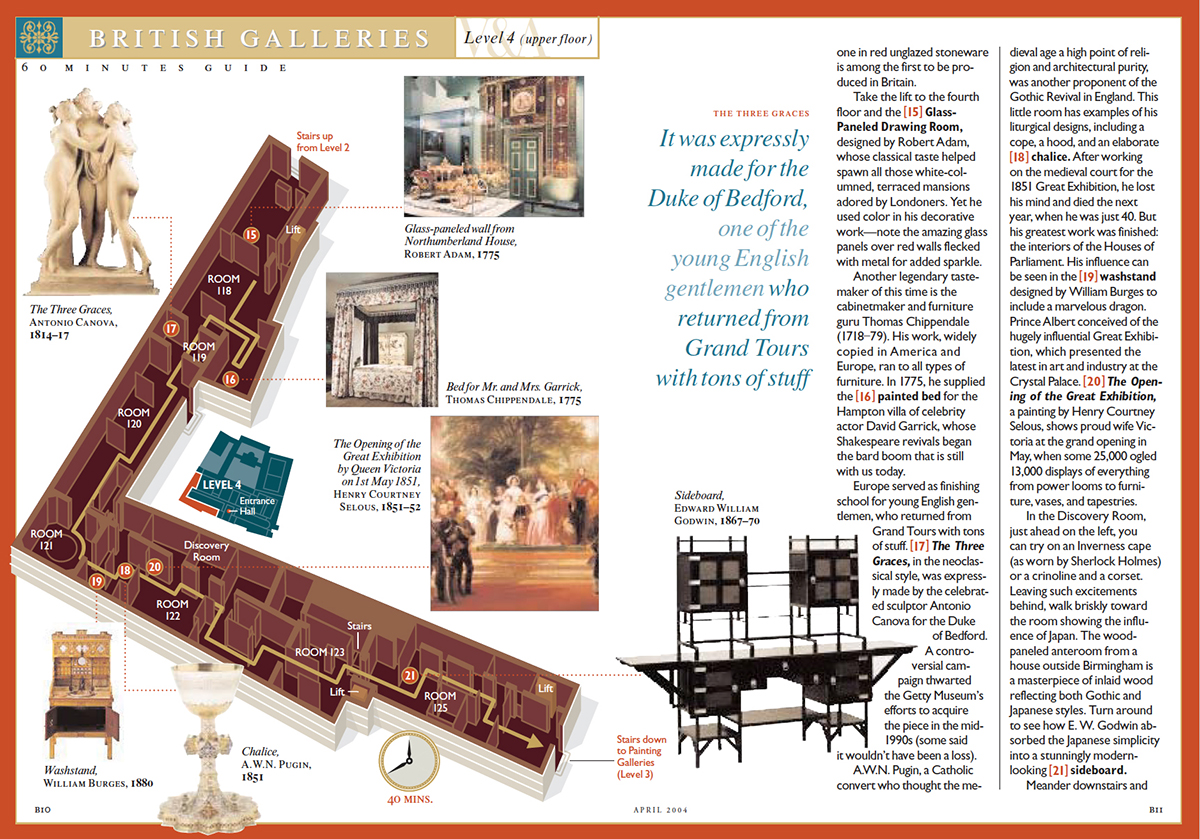
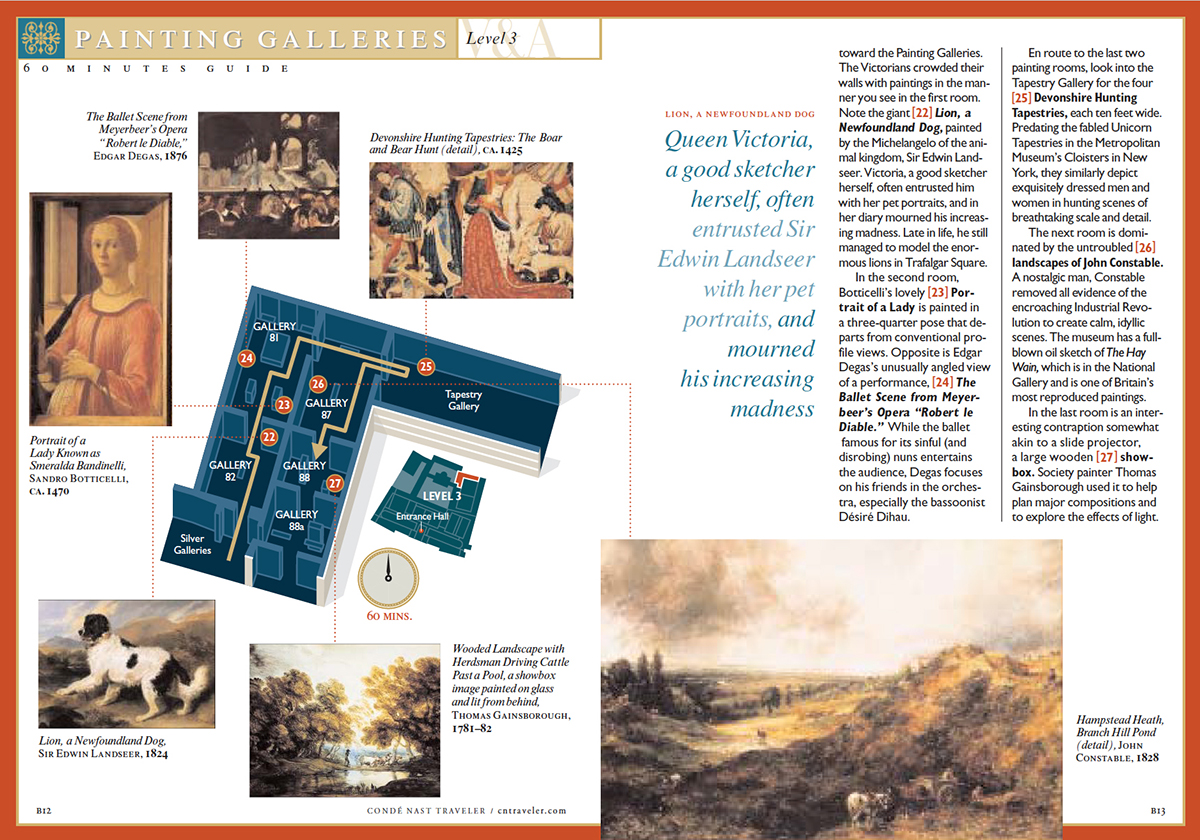
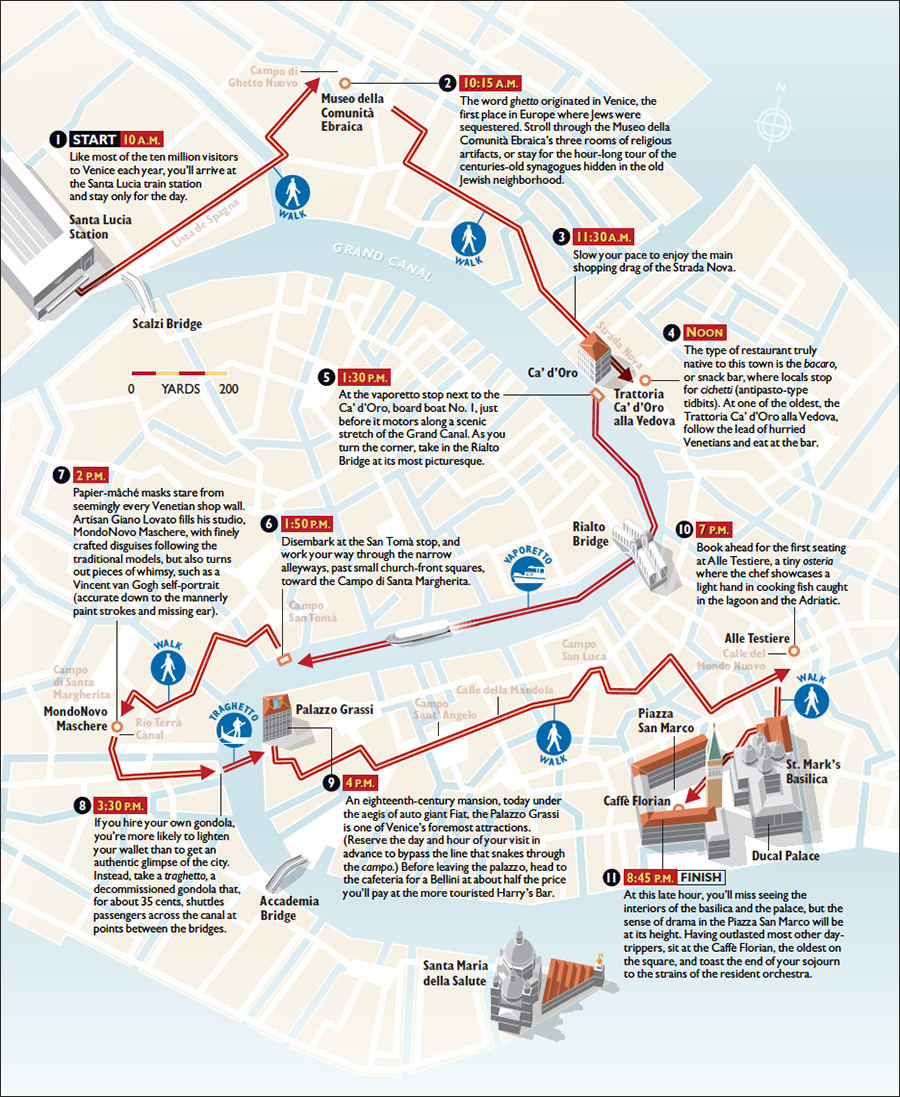
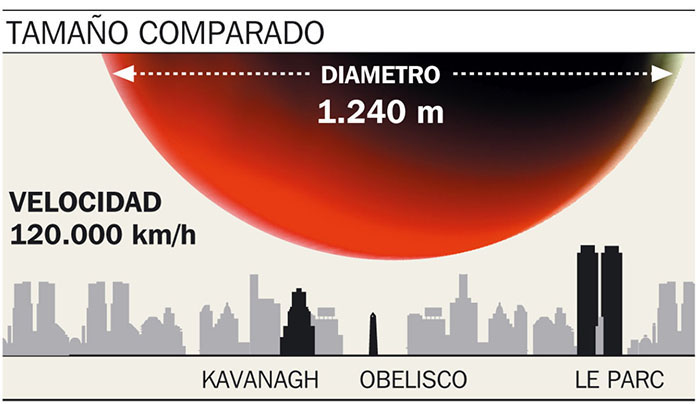
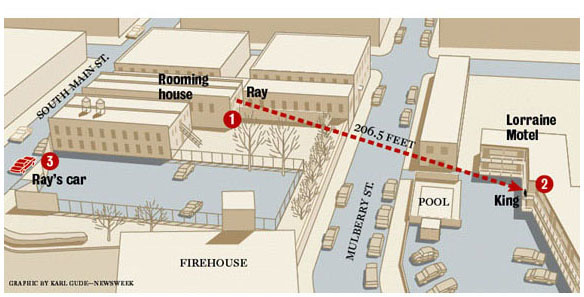
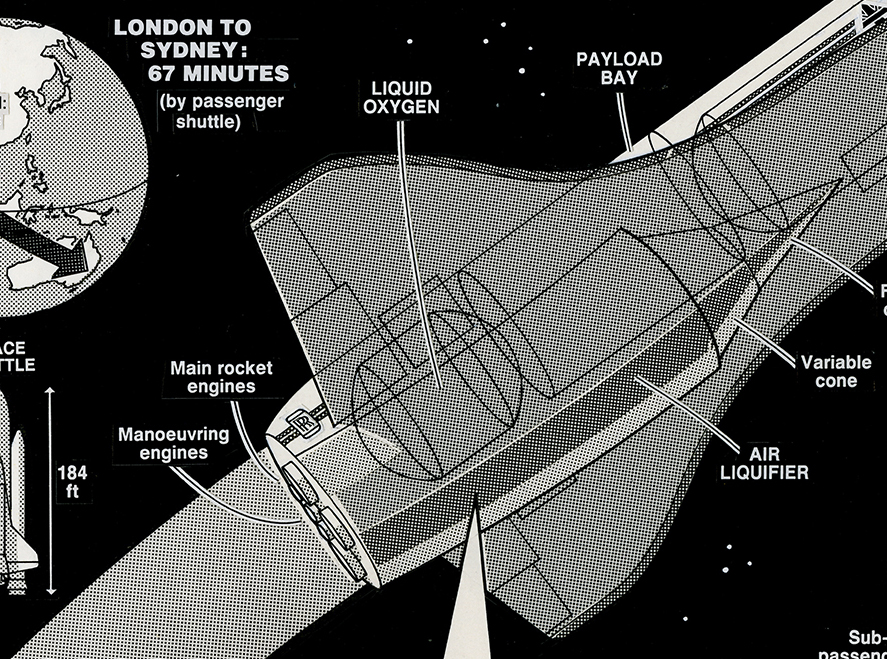
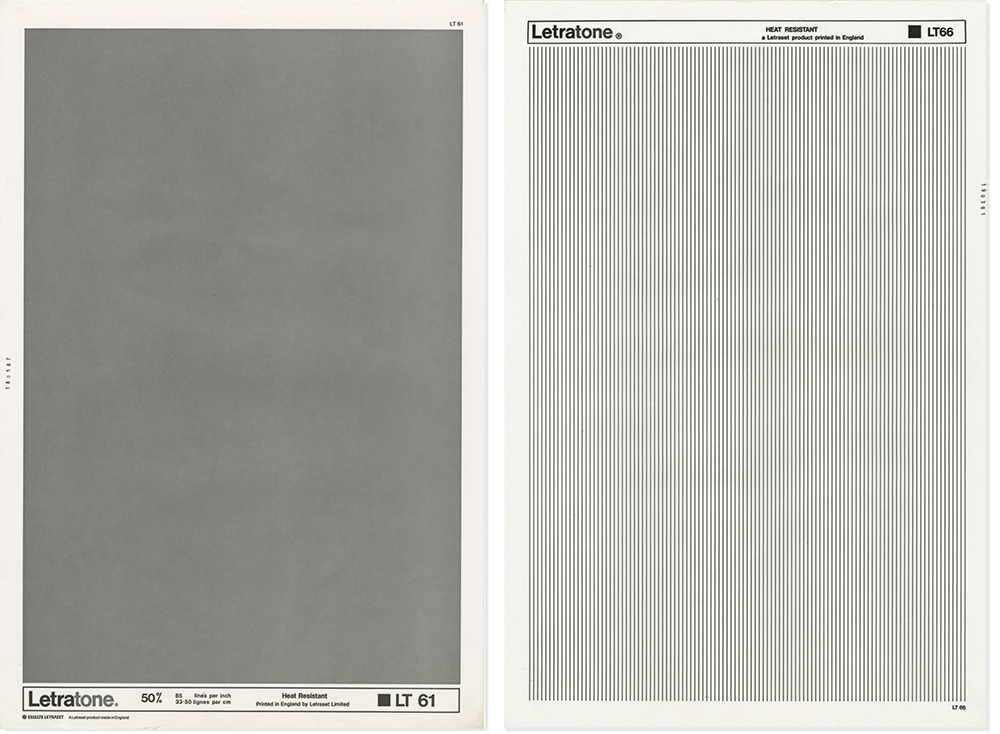
Back in the 1970s and 80s, Letratone ruled. (It was Zip-A-Tone and Chart-Pak in the U.S.) These sheets of adhesive-backed dot patterns and lines were vital to create the gray tones in line art, which was the staple of many print publications. With a variety of sheets, and a sharp knife, you could go crazy adding various grays, gradations, and all manner of line effects. Of course, you had to make sure that you were using the correct line screen for the reduction, otherwise the whole thing could fill in. This example is borrowed from the Grimwade National Archive (which is basically a drawer in someone else’s office). In the detail especially, you can see that the shrinkage of the adhesive tone over the years has left some white gaps. This would not be easy to fix without damaging the line art, so it will probably stay like this.

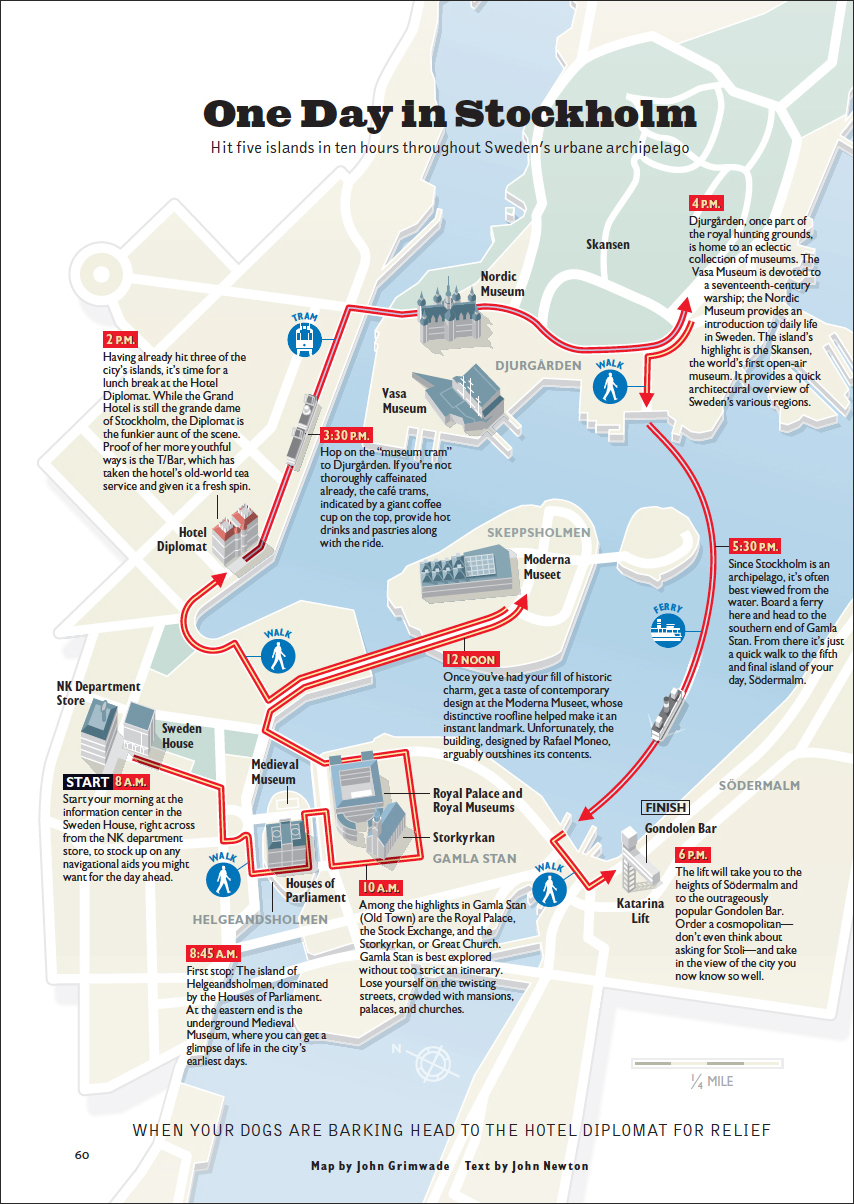
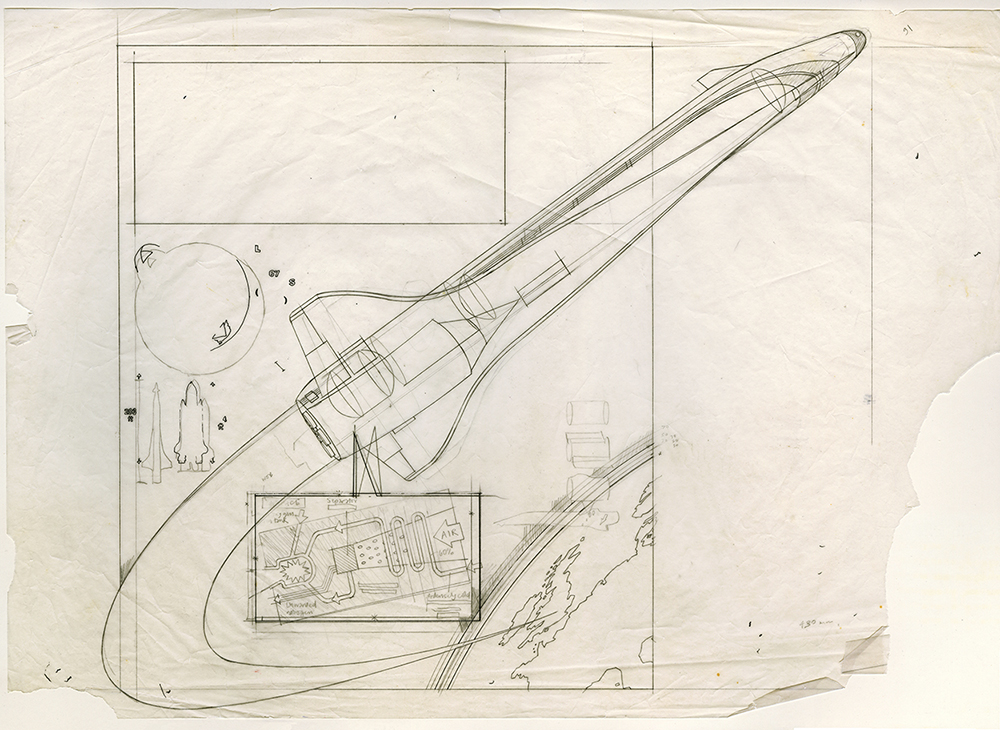
Below is the rough drawing that I started from. More roughs: https://www.johngrimwade.com/blog/2016/10/10/the-rough-idea/

I just purchased two sheets of Letratone on eBay. They arrived in pristine condition.

Coming soon Professor Michael Stoll (who has featured in number of posts) is putting on an exhibition of my work in Munich, from March 9 to 11, at the EDCH and INCH conferences. He has scanned a lot of the original art, and generally put a shocking amount of time into the whole process already. There will be several clear cabinets containing pieces of artwork, and some of the equipment used to produce it, plus posters showing how the art looked in the printed form. The exhibition is a comprehensive view of my career from analogue to digital.

The conference is in two parts: EDCH is Design and INCH is Infographics. I’m also running an infographics workshop. Perhaps I will see you there!

Design: http://www.edch-conference.com

Infographicshttp://www.inch-conference.com

Workshops: http://www.inch-conference.com/en/workshops

Infographic gods

I’M A PERSON, HE’S A CARVING, BUT WE EACH HAVE OUR INFOGRAPHIC ROLE TO PLAY.

UNSOLICITED PRAISE In 1999, I received this letter. The person who sent it is now a Master Lecturer in the Writing Program at Boston University. Sometimes in my career, especially in the early newspaper years, I felt like a second-class citizen. “He’s just a graphics person,” was an attitude that I came across several times. I know other older (or just plain old) people in the field who have experienced this mindset, which (thankfully) has mostly disappeared in the last few decades. So although this is a very lofty, and certainly undeserved, designation, it works for me in terms of being the complete reverse of that “who cares about infographics” attitude. Thank you, Marisa.

THE GOD OF GRAPHICS A wooden figure from Mexico has stood over all the graphics departments that I’ve worked in. Back in the early days at Condé Nast Traveler, we decided that this would be our talisman, looking after our infographic well-being. Now sporting a worrying crack in the torso, but as inscrutable as ever, the God of Graphics still watches over my studio. He/she doesn’t love my data-to-ink ratio, but I’m working on that.

More rubbish

INFOGRAPHICS THAT WENT WRONG.

I am finding far too many of these badly-conceived graphics in my collection. I could delete the files and pretend that I didn’t create them (“What food chart?”), or post the examples here and hope there is something positive that can be taken from them. We all learn from our mistakes, and I encourage my students to be adventurous, even if potential failure lurks in the shadows.

Concorde confusion Questions: Why does the color used for Concorde and the 747 keep switching around? Was my medication wrongly prescribed? There is an interesting use of boxes as well. I have trouble believing that I am responsible for this one. On second thoughts, it must have been done by someone else. Well, that’s a relief.

Catering nonsense There is, believe it or not, an underlying logic to the chart below. I wrote it all out on a piece of paper, so there must be. One chicken represents 200 lbs. One apple equals 6,000. (What?) These items cannot be compared, and it doesn’t make any sense as a chart. This is complete crap. Memo to curriculum committee: Do not let this person teach data visualization.

Styling takes over The next infographic (might be the wrong name for it) apparently explains and compares the cockpit systems of Airbus and Boeing. It’s a very poor graphic, but a very fine example of a heavy-handed stylistic idea ruining an explanation.

NO That’s my only comment on this wheel thing.


The infographic from hell

NOT ONE OF MY FINEST MOMENTS.

We have all probably had an infographic (or several) that failed. Perhaps the original concept was flawed, the information was of poor quality, or the execution let the project down. In my career, I have had numerous misfires. They have mostly been deleted, or consigned to old and (hopefully) unreliable hard drives. This is one of the most memorable examples. It’s from my “Looney Tunes” period, complete with wacky perspective, drop shadows, and assorted other types of graphic gimmickry. It is clearly an infographic that cannot be trusted.

In fact, while it was in the preliminary stages, Alexander Liberman, the legendary editorial director of Condé Nast, summoned me to his office (for the one and only time) to explain it. And somehow, in a feat of surprising infographic gusto, I managed to persuade him that it was showing something worthwhile. However, his initial reservations subsequently turned out to be entirely justified.

Once the pain of an infographic screw-up like this has subsided, it’s time to learn from the experience and move forward. Fortunately, I had better moments at Condé Nast, but I remembered this nightmare.

The red line

FOLLOWING AN INFOGRAPHIC PATH.

How do you make complex locations easier to navigate? At Condé Nast Traveler magazine we often gave our readers a fixed path, that was carefully chosen by our writers. The aim was to show the user, as clearly as possible, how to get to the selected highlights. Of course, this line didn’t need to be red (and often wasn’t), although red is good for grabbing attention. Remember that this was all before we could track our position accurately on smartphones. I’m not sure that location technology renders this kind of presentation obsolete, although it could definitely augment it.

Cairo’s Khan-al-Khalili souk is a challenging, but rewarding, place to visit. Very crowded, and not easy to see where to go next. We felt that the red line could really help here. The text starts with an instruction to look for the green pedestrian bridge, so I the only place in the graphic that I used green is there. Monochrome photographs separate strongly from the color of the map.

The complete gatefold is shown below.

The Victoria and Albert Museum in London is a maze of levels and additions, containing millions of objects in 145 galleries, and it is consequently quite difficult to find your way around. So this little booklet was very popular. Brilliantly written by Manuela Hoelterhoff, who also selected the essential exhibits. You would have to keep up a very brisk pace to get round this track in 60 minutes, but the title is fun, like the text, and is really an attention-grabber. (It was part of a series that included the Louvre and New York’s Metropolitan Museum). The series name is more an indication of the fact that it’s possible to see the best parts of a collection in a relatively short time, and not have an exhausting, and unsatisfying, afternoon slogging around looking for the best things to see. Self-contained spreads lead the user from one location to the next. It’s not really necessary to know where you are in the entire museum, but it’s shown with a locator inset.

I produced numerous city guides using the same idea. A writer would research the locations and the path to connect them. I would make a graphic of it. Mine was the easy part, I think.

Reality It might be hard to believe, but I didn’t know about Boston’s Freedom Trail before I started using the red line approach. (Let’s face it, it wasn’t likely to be an idea that no one had thought of before.) I soon discovered that the idea had been made reality way back in 1951. There’s a red brick line that runs through downtown Boston for 2.5 miles (4 km), and leads visitors past 16 significant historical sites. I’d somehow always imagined that there really was a red line in the places that I was drawing, so this just confirmed my delusion.

(Photograph © sam74100/123rf)

(Photograph by Ingfbruno)


Infographics made easy

MANAGEMENT’S DREAM.

Most of us have come across some annoying attitudes towards infographics. Like: “Isn’t it all done by your computer?” or “Are you still working on that?” Several years ago (when software was still sold in boxes), I decided to create a make-believe program that would make the bosses very happy. In the future, our replacements might be robots, or androids, but fortunately for us, the companies will probably not contemplate that kind of huge investment in infographics. (Although now I think about it, some of the people that I’ve worked with might have been androids.)

Fast forward There are many resources online for making a quick and easy “infographic,” and plenty of stock infographic elements available to help us bash together something that looks like it might be informational. All of this is cause for considerable concern. You can see the damage all over the place.

I really wish I could say that the “infographics are a luxury” attitude has disappeared since I made this spoof software, but in the last few years there have been numerous examples of it still existing, and it is often followed by the dreaded cutbacks.

Anyway, to those organizations that realize the value of our craft, and support us, I say a big thank you.

Footnote: “Fourteen-A Graphics” is a reference to how many “A”s were needed at the time to get to the top of the phone directory listings.

Tools of the trade

INFOGRAPHIC GEAR BEFORE THE COMPUTER.

Need a circle? Use this.

When I started making infographics, every freelancer in the business carried a briefcase everywhere they went. It was filled with all the equipment needed to make artwork. You needed technical pens, french curves, ellipse templates, compasses, ruling pens, paintbrushes, a craft knife, and so on. We spent a lot of time in art supply stores, buying designer’s colors and inks and everything else. I still love those places more than any other shops, although there are a hell of a lot less of them around now.

There were some problems that we don’t have today. If you ran out of ink on a Sunday, you were finished. Stores were closed for the day back then. Then there were the accidents: cuts from very sharp knives, bottles of ink knocked over onto elaborate artwork, airbrushes suddenly spitting paint over beautiful backgrounds.

Yes, it was stressful, but it was also a craft, and it felt like one. Like making furniture or pottery, or something arty. We were artists, or at least we thought we were. After all, we used some of the same gear, just no beret or white smock.

This compass set once belonged to Peter Sullivan, and was used to create numerous classic infographics. It is Swiss-made and is wonderful to use. It contains ruling pens and compasses of various sizes, including a drop-bow compass for very small circles, and an extension bar for large ones. Notice the small circular stand that lets you draw a circle without the compass point making a hole in the artwork.

French curves were essential. I had some wooden ship curves for long, gentle arcs, and a difficult-to-use Flexicurve (a plastic bendable rod).

Ellipse templates were needed in multiple degrees and sizes to draw all the perspective circles in a piece of art. In a rough drawing, I would note the ellipses needed for the artwork, otherwise it meant painstakingly matching them up to their respective templates again. I had many of these crammed into my briefcase.

A more exotic instrument. The eleven-point divider was used for division of a line into up to ten equal sections, such as a scale on a chart. I never really used it, I just liked opening and closing it.

Below is a proportional divider. Used for transferring dimensions from one scale to another, or for dividing up lines equally.

A proportional scale for working out scaled sizes was a staple of design departments back in the dark ages.

Little gems

A VERY CLEAR STATEMENT CAN BE MADE IN A LIMITED SPACE.

I’ve often been given a lot of room for my infographics, and I admit it, I have not always used that luxurious amount of space wisely. So let’s give a hand to the hard-working small graphic that makes a simple point, and makes it clearly. It is the polar opposite of the mega-graphic, but is just as important. Here are two excellent examples.

How big is that asteroid? A comparison to Buenos Aires landmarks. By Alejandro Tumas for Clarín.

The shooting of Martin Luther King. A reduced palette aids a crystal-clear explanation. By Karl Gude for Newsweek.

Wheel of excuses

EXPLAINING AWAY VARIOUS PROBLEMS.

In 2017, dialing up some useful excuses could come in handy for freelancers, professors, students, and everyone else. I’ve often needed something creative to calm down an anxious client. Unfortunately, this wheel doesn’t seem to be available right now (except perhaps on eBay), but when it reappears, you might want to get one. No batteries required.


CARDBOARD INTERACTIVES (PART 2)

On a more serious note, this is the second part of a wheel charts post that I ran last week. The first part is here: https://www.johngrimwade.com/blog/2016/12/26/cardboard-interactives/

An astrolabe (astronomical calculator) from 1575.