
SOPHISTICATED CHART-MAKING FROM 1954.
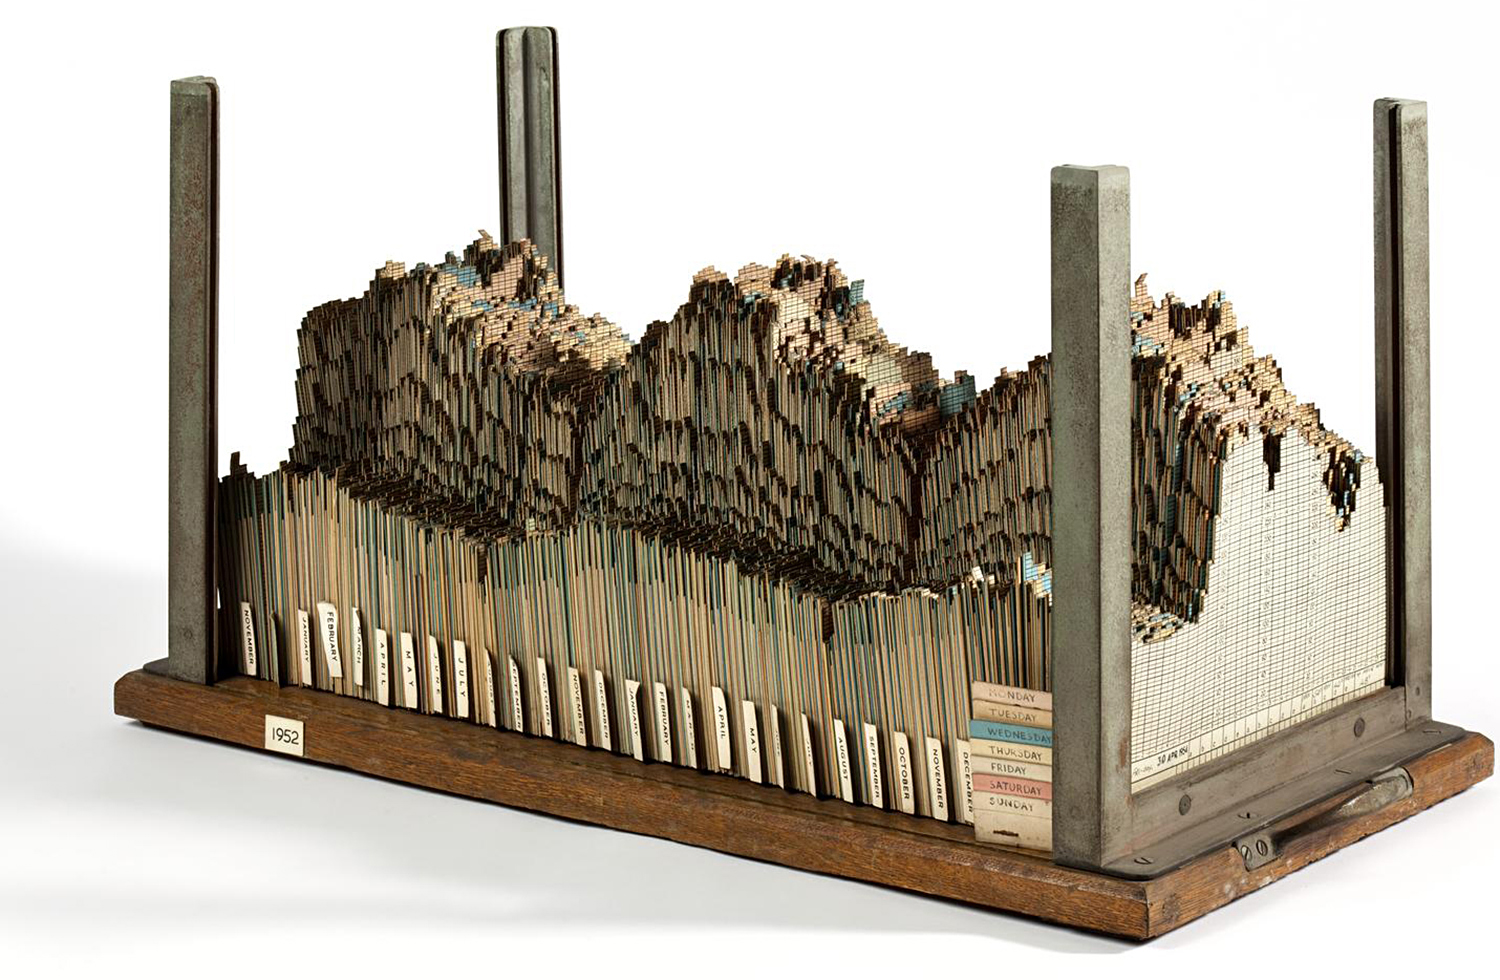
This set of 675 hand-cut cards shows the demand for electricity between October 1951 and April 1954. The cards are held by metal uprights on a wooden base, and were once enclosed in glass. Dimensions: 26.5 x 12 x 14 inches (67 x 31 x 36 cm).
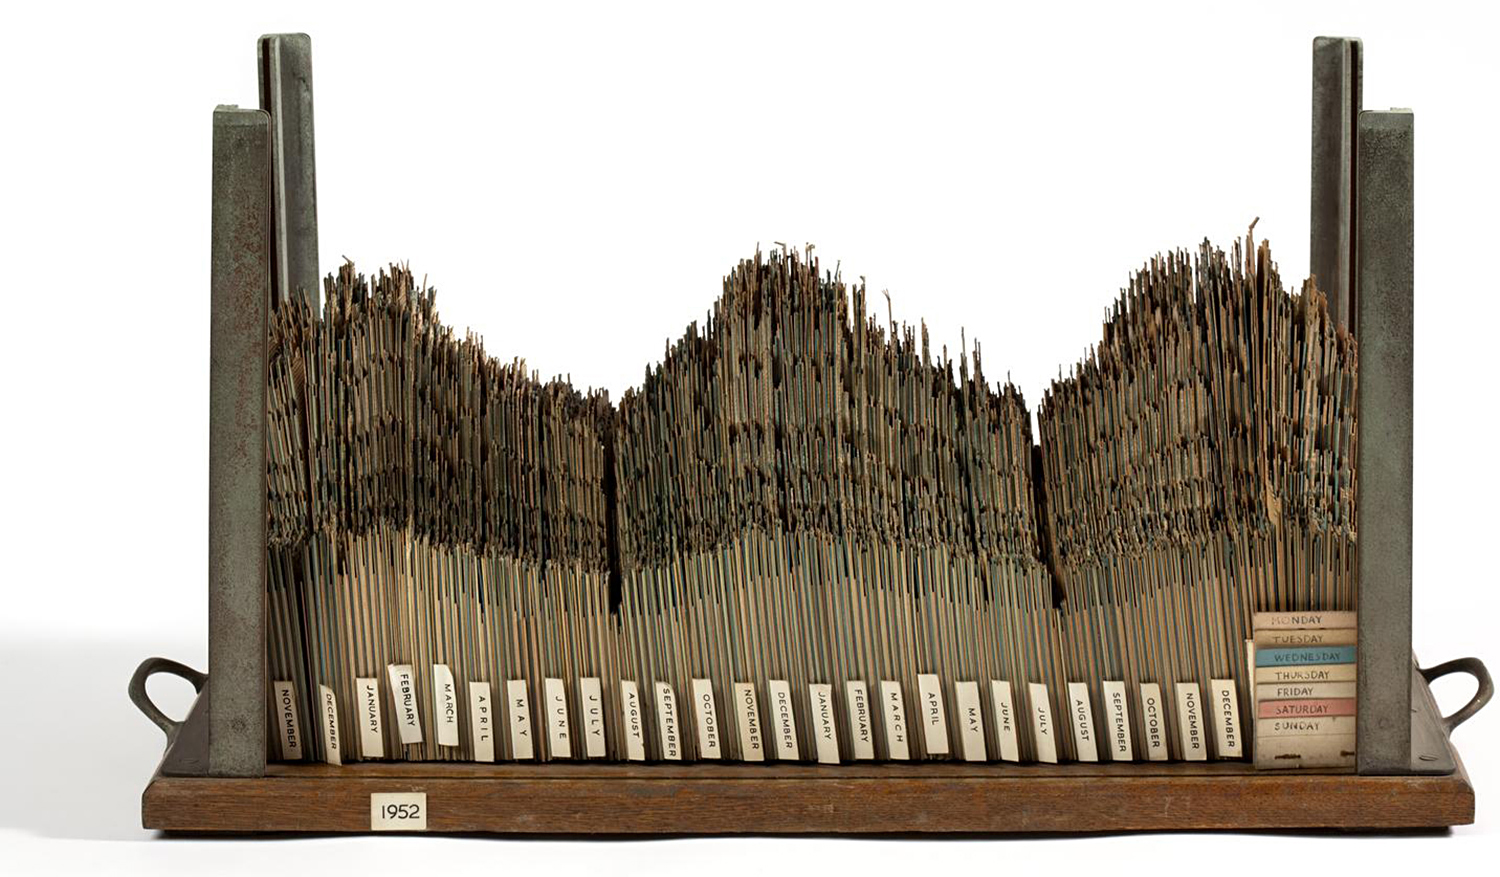
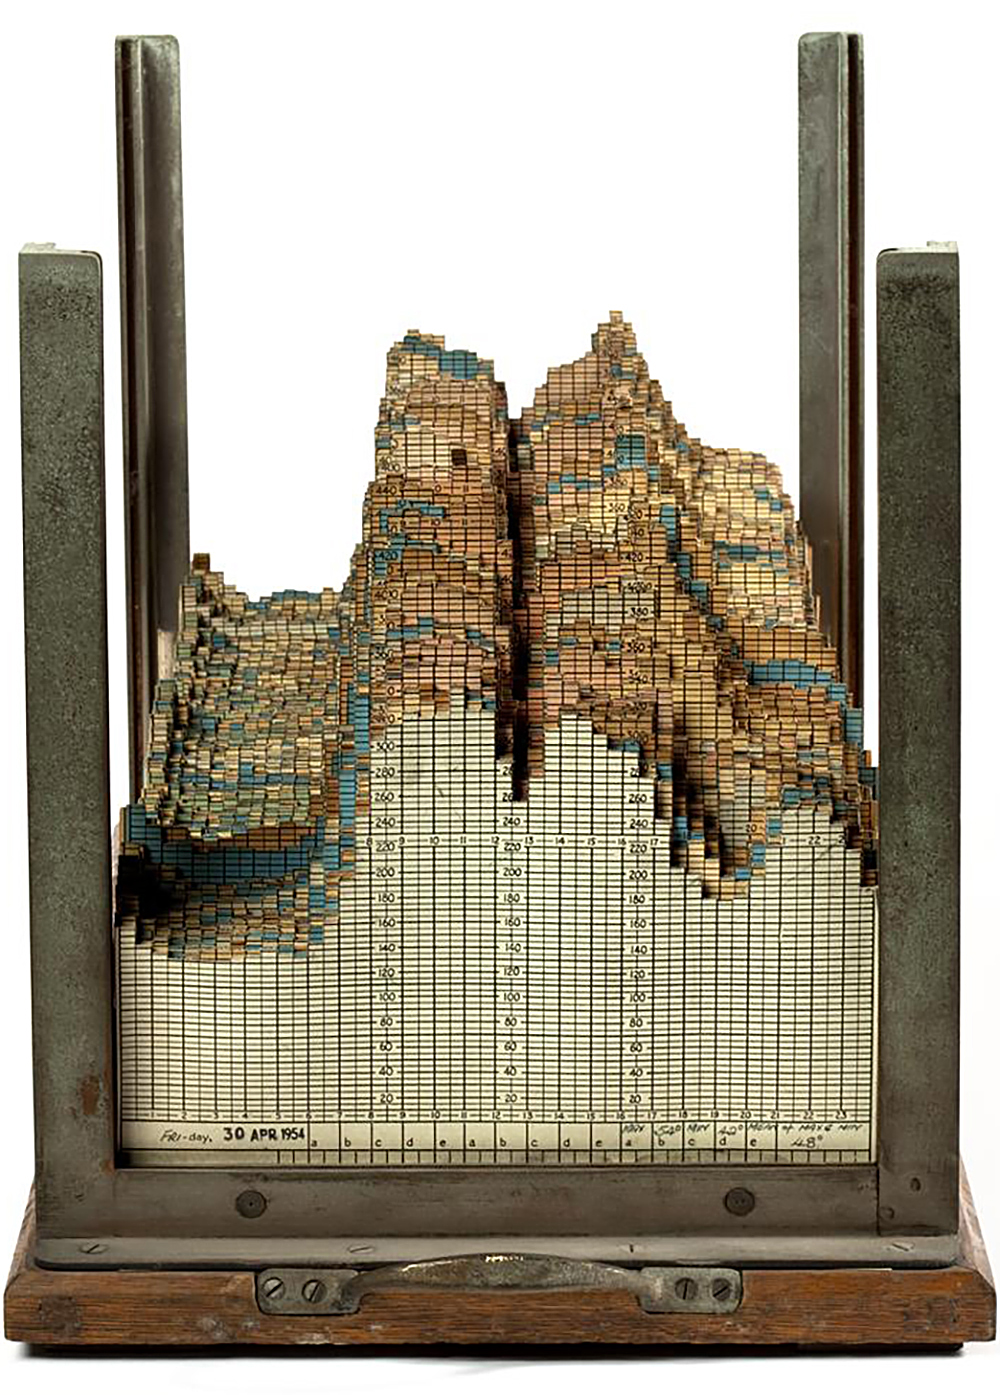
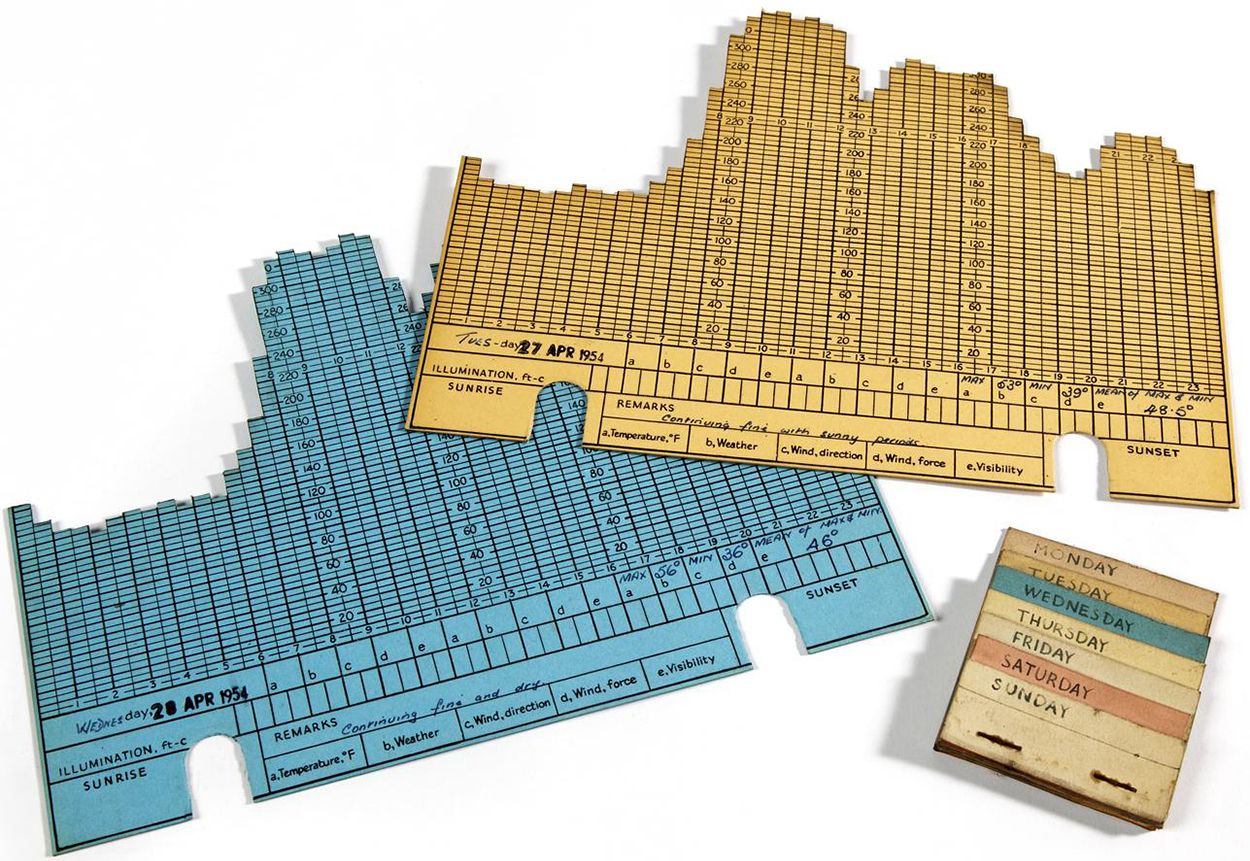
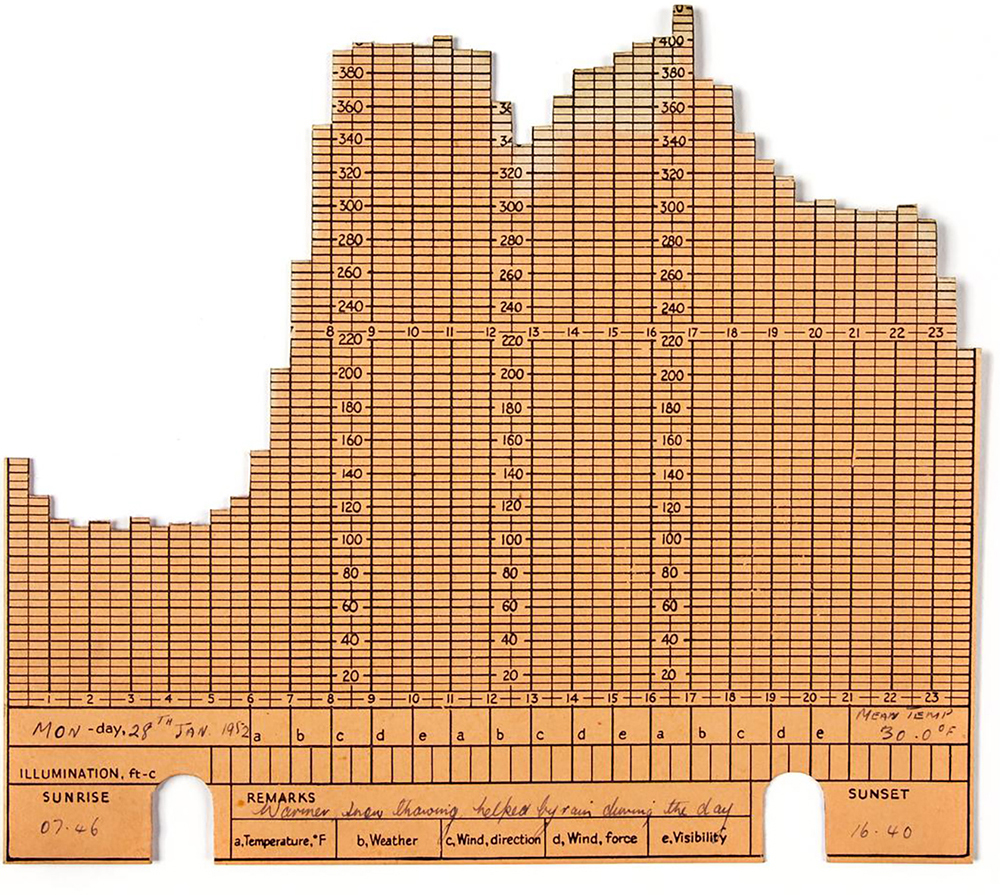
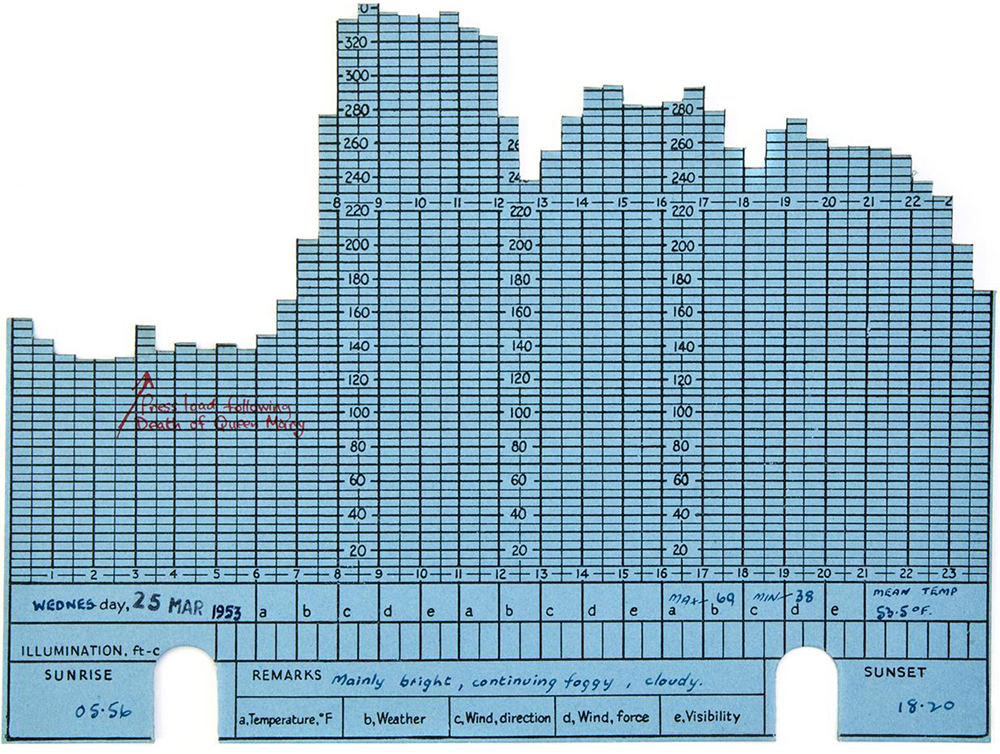
Each card plots demand in megawatts over the course of one day in 30-minute increments.
Photographs: Museum of Science and Industry.
This kind of load model is not unique. Here are some examples from other countries.
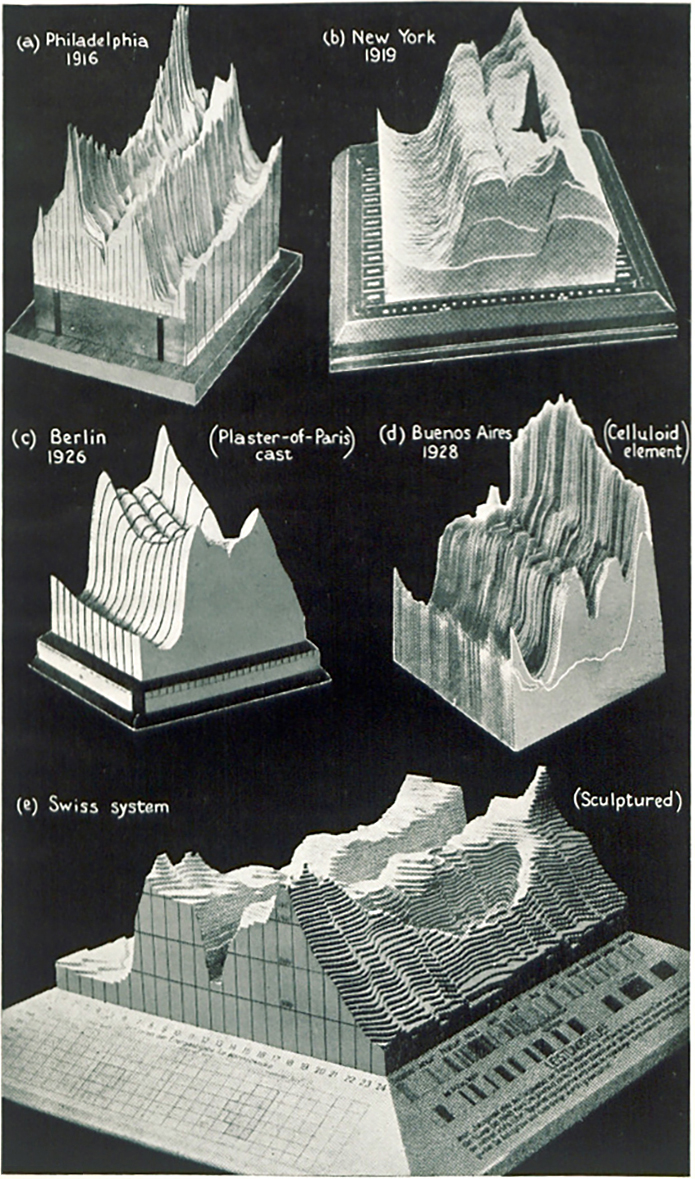
Image: The British Library.