
VISUALIZING CHINA’S AIR QUALITY DATA.
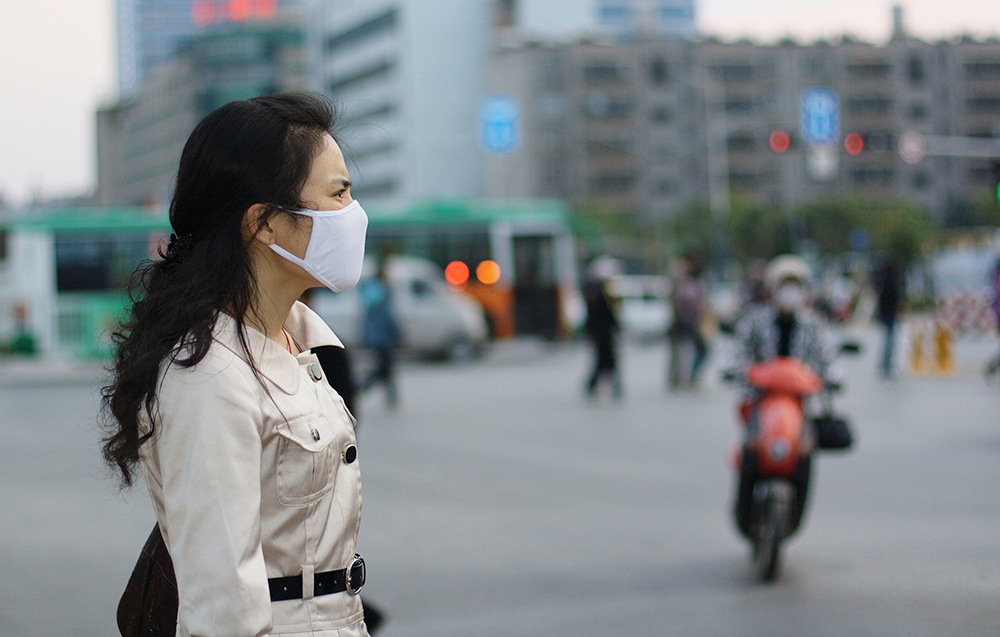
(Photo: iStock.com/BarnabyChambers)
On a trip to China a few months ago, I fortunately did not see much of the legendary smog. However, I was told that, in Beijing and Shanghai, it’s a very good idea to have a mask handy, especially in the winter months. People regularly check the air quality levels (and the forecast) on their phone, or other device.

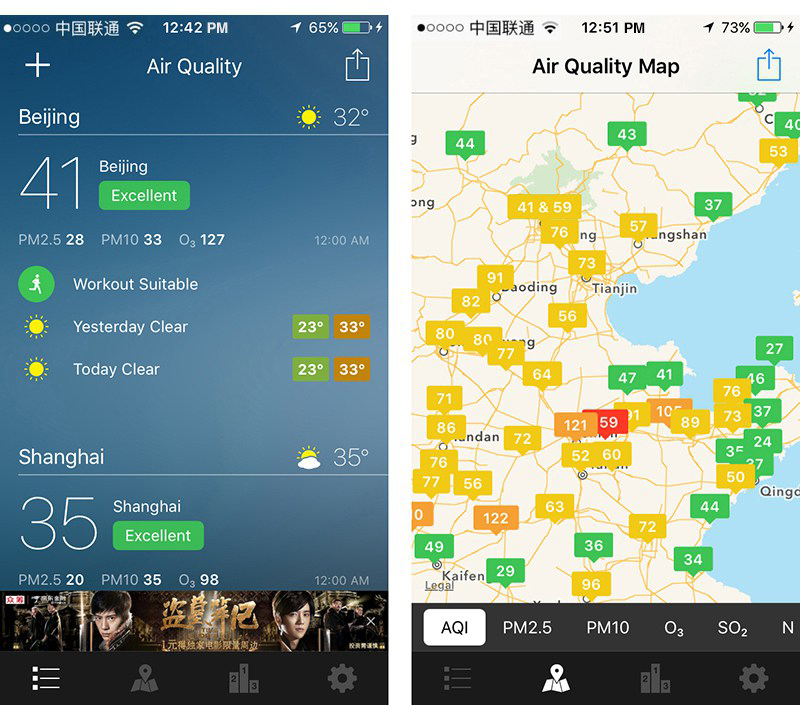
I downloaded this iPhone app, “China Air Quality Index,” just in case. Never really needed it though,
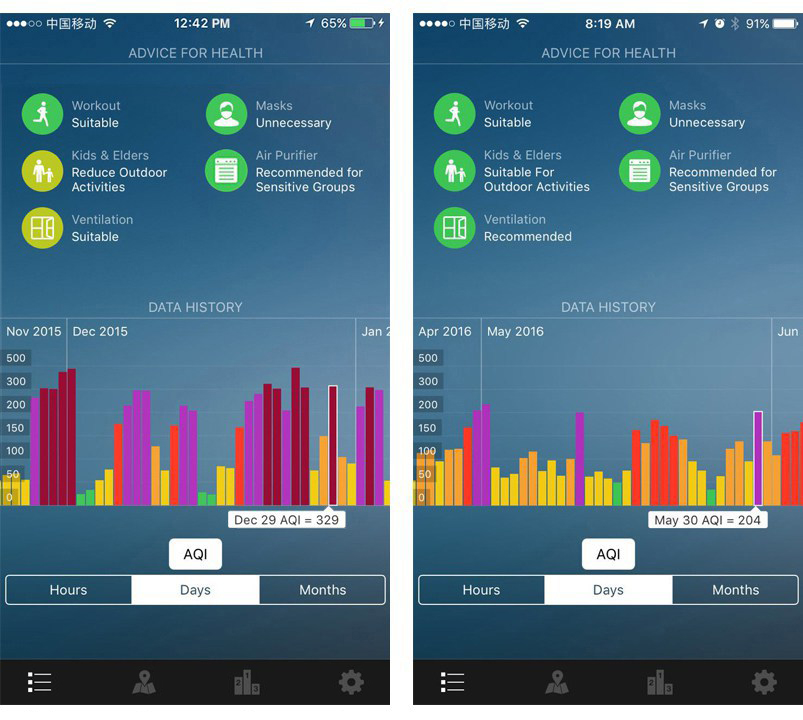
Data history: Below are the difficult days of December 2015, compared to the better days of May 2016. Sent to me by Wendy Huang, and Nicole Cheng, former VisCom M.A. students, who live in Beijing.
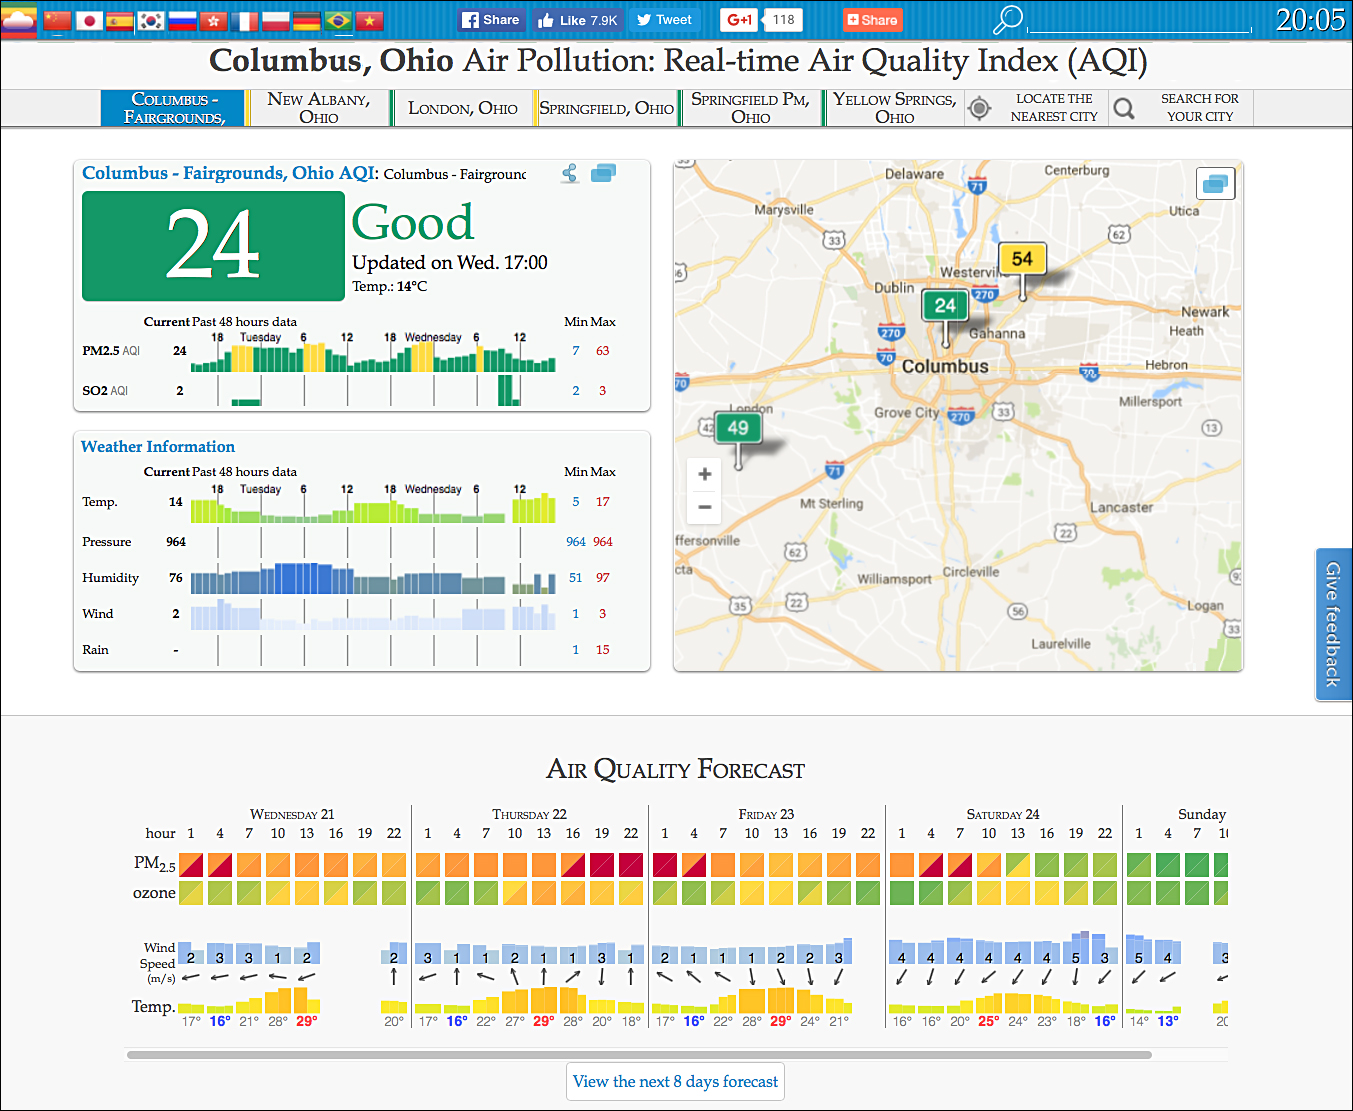
Information online: We seem to be good in Ohio. This is yesterday’s data for Columbus from the Real-time Air Quality website, which is based in Beijing. The world-wide database has air quality metrics for many locations. See if you need to wear a mask here: http://aqicn.org/
It’s easy to see the value of data visualization that helps with daily life. And, of course, this is just one of many, many everyday examples. I’ll be talking about several other ones in the future.
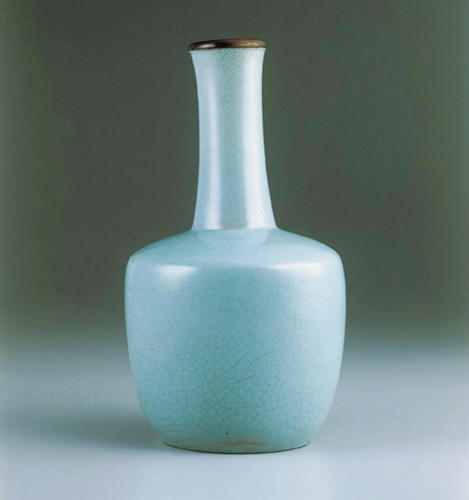
Footnote: Nigel Hawtin, an infographic friend from the U.K., told me about this project after he saw the original post. It’s the work of RCA masters student, Yijin Huo. Vases that are glazed according to pollution levels in Beijing.
This is the color of the classic Ru porcelain vase.
And these are pollution-colored ones. Matched to samples of the Beijing sky.

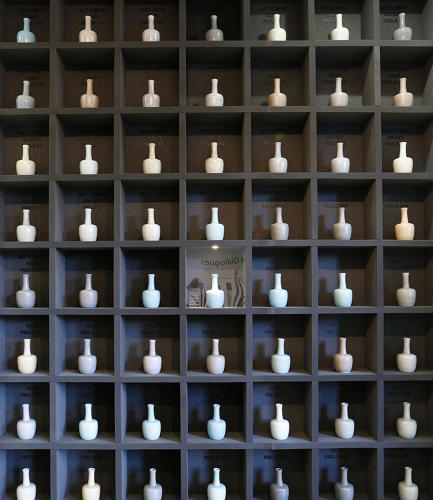
There’s more information here: https://www.fastcodesign.com/3061434/infographic-of-the-day/these-vases-are-stained-to-match-beijings-polluted-skies